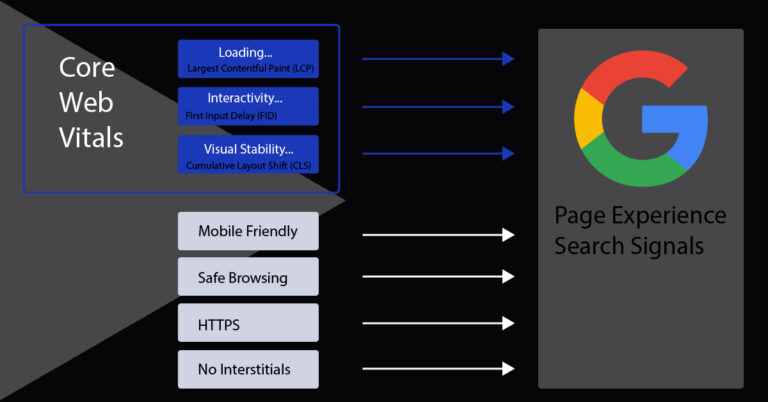
Google core web vitals are 3 signals that Google considers important to the overall user experience. They were designed to measure how users experience speed, responsiveness, and visual stability of a page.
In this article we are going to explore CWV metrics and how you can improve them.
Why Core Web Vitals are important
Google is planning to make page experience an official ranking factor in 2021. The page experience update is believed to hit sometime in May 2021, but you can start preparing for it now.
Judging by the name, these 3 signals will make up a good chunk of the overall page experience update, but there are other factors as well.
These metrics are a good indicator of how the end user experiences your website. Think about the last time you visited a site…
If it took to long to load, you probably abandoned the site. Large shifts in the layout made it difficult to read also causing you to leave. These are things to consider about your own site.
The percentage of sites that have passing grades is relatively small, but this presents you with an opportunity to improve and increase your rankings.
What percentage of sites have passing CWV grades?
Screaming frog did a study on Core Web Vitals and determined a small percentage, 12% of mobile and 13% of desktop results passed the assessment. They analyzed 2,500 keywords and 20,000 URLs.
This is a small sample size but it is indicative that there is much room for improvement. If your site has failing grades for these metrics, don’t fret because you are not alone and you still have time to improve.
Having passing grades for these signals won’t magically push you to first page results but it will be a factor. It is important to note that there are over 200 factors that Google considers when ranking a page.
Their ultimate goal is to serve the most relevant results for the query so keep that in mind.
Core Web Vitals Consist of 3 Signals
First Input Delay (FID)
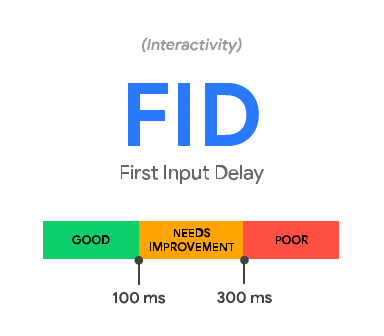
First Input Delay (FID) measures the time from when a user first interacts with your site (i.e. when they click a link, tap on a button, or use a custom, JavaScript-powered control) to the time when the browser is actually able to respond to that interaction.
FID measures the time it takes for a user to actually interact with your page. As you can see from the image above a good score is less than 100 ms.
Interactions include:
- Clicking a link
- Filling a form
- Selecting an option from a menu
- Playing a video
Largest Contentful Paint (LCP)
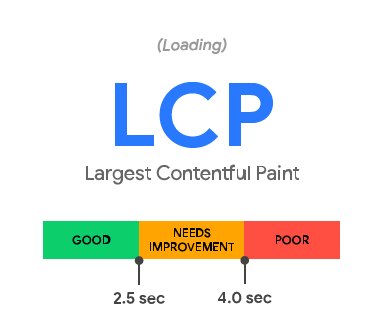
LCP measures when the largest content element in the viewport becomes visible. It can be used to determine when the main content of the page has finished rendering on the screen.
This is the perceived time it takes to your visitors to view the content of the page. As you can see from the image above, less than 2.5 seconds is what you want to aim for.
This can be difficult for pages with a lot of elements.
Cumulative Layout Shift (CLS)
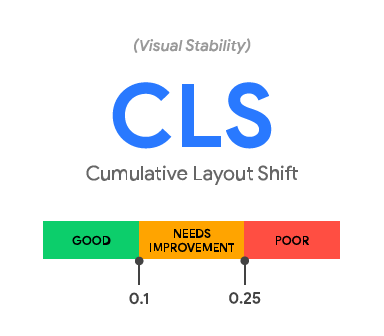
CLS measures the visual stability of content. It looks at how much visible content shifted in the viewport as well as the distance the elements impacted were shifted.
Have you ever visited a page, began reading only to have the entire page shift? This is CLS and is not a good user experience.
This shift can be caused by several things including font swaps, slow loading third party scripts, etc…
Other Page Experience Signals
- Mobile friendliness (responsiveness)
- Safe browsing (no malware)
- Https (security)
- No interstitials (intrusive popups)
Mobile friendliness
Is your site responsive? I would say the vast majority of sites are now mobile responsive, but to be sure you pass you can evaluate it using the mobile friendly test.
If all goes well with your test you should see the image below: “Page is mobile friendly”.

A mobile friendly design ensures your pages perform well on all devices.
Safe Browsing
Google wants to make sure that they are delivering results that are safe to view and contain nothing malicious.
“Pages or sites affected by a security issue can appear with a warning label in search results or an interstitial warning page in the browser when a user tries to visit them.” – Google Support
You can check for any security issues in search console “securities report”
Https- SSL Certificate
Is your site encrypted with an SSL certificate? Google has been pushing web security over the last few years. Even if you are not selling anything, make sure your site is secured with SSL.
If you still have insecure content, Google may flag your site as unsafe. Learn how to install an SSL certificate on a WordPress site for free.
Many hosting companies have partnered up with Let’s Encrypt to bring you free certificates so there’s really no excuse anymore for not securing your site.
No intrusive interstitials
This signal is more about accessibility and particularly important for mobile. No full page ads. Popups are ok but be sure your main content is still visible.
The image below depicts what is acceptable and what is not.
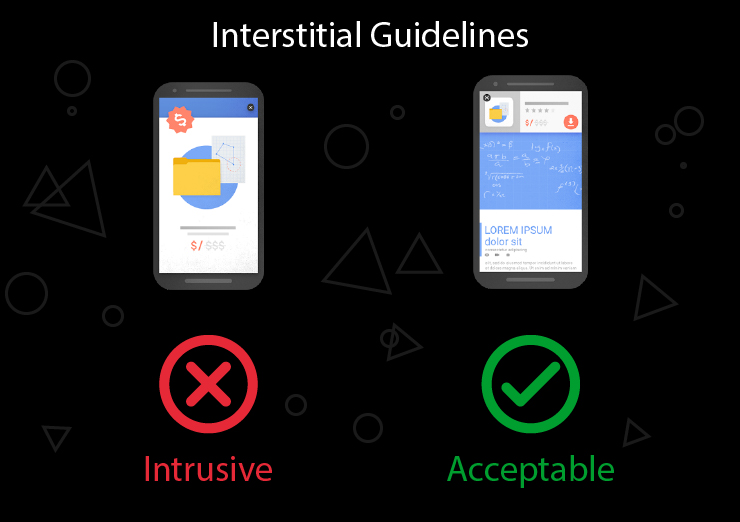
To improve the mobile search experience, after January 10, 2017, pages where content is not easily accessible to a user on the transition from the mobile search results may not rank as highly.
How to test for these Page Experience Metrics
There are several tools you can use to test your site including Google’s own, ‘Page Speed Insights’ testing tool where you will be provided with opportunities for improvement.
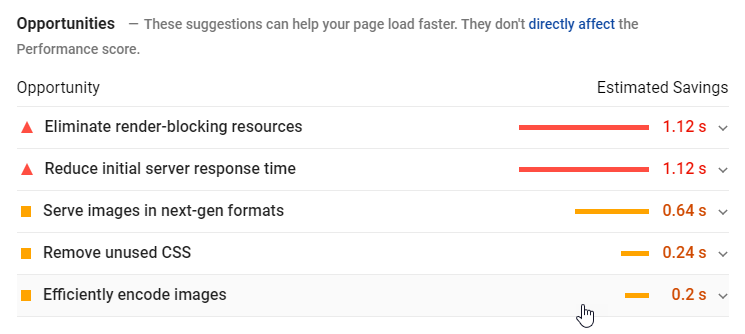
In addition to the page speed insights tool, you can also use chrome dev tools within your browser by right clicking and selecting “inspect” > “lighthouse”
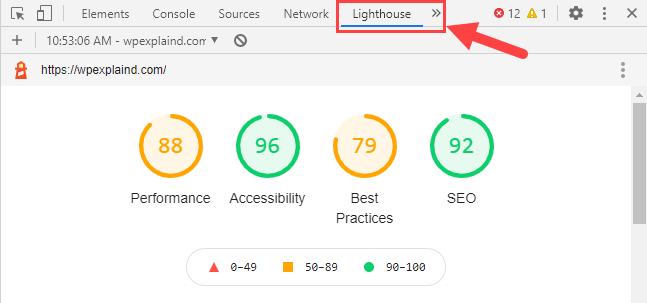
or accessing it from Search Console under “enhancements. This will provide you with an overview of your entire site and how each page performs.
Improving Your Web Vitals
Every site is different and will require personalized tweaks for improvement, but here are some general guidelines for improving your web vitals.
Upgrade your hosting: Shared hosting means share resources and ultimately slower loading times. We recommend Flywheel. It’s a little more expensive but your site will load faster.
Set up lazy loading: This will defer downloading your offscreen images until they appear in the viewport.
Add image dimensions: Adding missing width and height attributes to your images tells the browser to reserve that space and helps reduce layout shifts. WP Rocket can now add missing dimensions to your images simply by checking a box.
Minimize third party scripts: Third party scripts like Google Analytics are out of your control and difficult to optimize so only add what’s necessary.
Minify your CSS: CSS files are render blocking which means they need to download before the page can be rendered. Reducing their size by minifying them can help reduce LCP.
Defer JavaScript: This eliminates render-blocking JS on your site and can improve load time.
Leverage browser caching: Caching your files in your browser will speed up delivery for second time visitors.
Clean your database: your database can become bloated with post revisions and transients. Clean it up weekly for optimal performance.
This can seem overwhelming especially if you’re not a front end developer. Luckily, there is a plugin we recommend that can help with many of these optimizations.
Recommended Plugin For Improving Page Experience
WP Rocket is a plugin that will solve many of the recommendations you will receive in page speed insights.
WP Rocket will take care of most of the recommendations, but not all. To further improve, I recommend using an image compression plugin that will efficiently encode images and serve them in next gen format.
For this we recommend either WP Smush or Imagify.
Conclusion
Delivering a good user experience is at the top Google’s list this year. As it stands a large portion of the web is not ready for this, but luckily you still have time. Don’t wait until the last minute.
Begin improving your UX today!
